
A dashboard is a tool that quickly shows you vital information.
In your car, you can check the dashboard to see how fast you’re driving and how much fuel you have left. A sales performance dashboard gives you access to key performance indicators (KPIs) and other valuable information whenever you need it.
We will show you how to create the ideal sales performance dashboard.
An effective sales dashboard can reveal problem points within your sales cycle and show where you might exceed expectations.
Read on to learn which KPIs and other metrics you should include in your dashboard.
Key Takeaways
- A sales performance dashboard gives you a clear visualization of critical sales data.
- Using an automated sales dashboard can help uncover weak spots in your sales funnel.
- Identify which KPIs are most important to your business and include those in your sales dashboard.
What Is a Sales Performance Dashboard?
A sales performance dashboard is an essential tool you can use to visualize the performance of your sales team. You can customize what information you want to see and even specify a specific time frame to view. With the right sales dashboard tools, much of the data is automated and ready to view whenever you are.
Sales managers and sales development reps (SDRs) frequently use performance dashboards to monitor sales activity and stay on top of quotas.
The needs of your business will dictate what kind of metrics you need to see in your sales dashboard.
This video provides a quick overview of a sales performance dashboard and what you can do with it.
Why Do You Need a Dashboard?
It can be challenging to monitor your team’s sales data without a sales dashboard. Sales reps would have difficulty uncovering missed sales opportunities, and it would be harder for sales managers to evaluate each sales representative.
While you may already use spreadsheets to keep track of sales goals and performance, it can be hard to visualize column after column of numbers.
A sales dashboard makes it easy to get an instant picture of your sales department and its performance metrics. It will include a variety of charts and graphs. Make sure you use the right kind of chart to match the type of data you need.
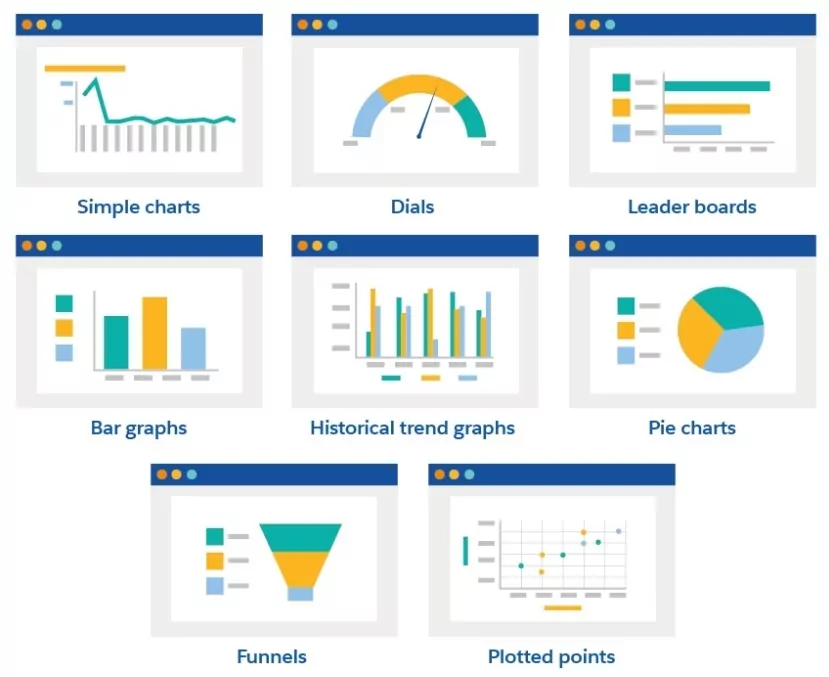
Source: SalesForce
Before you start creating your dashboard, ask yourself the following questions:
- Who will need to access this information?
- What purpose will your dashboard serve?
- How often will you use your dashboard?
- How much data do you want to include?
- What data points do you use most often in your reporting?
The answers to these questions can help you choose what you need to include in your dashboard.
Identifying Your Main KPIs
There are countless metrics that you could potentially use to build your dashboard. You do not need them all.
You need to focus on your sales goals and what ultimately guides your organization. Once you have your purpose in mind, you can choose the most important KPIs. Include these in your dashboard.
Here are some of the most common metrics used in sales dashboards:
- Leads by source: This metric helps you understand where your customers are coming from. Are most of your customer referrals from conferences or website demos? You can sort this information to discover your most profitable source of leads and focus more attention there while also exposing a potential need to diversify if most leads come from only one or two sources.
- Pipeline: The pipeline KPI will show you which stage each sales opportunity is in.
- Length of the sales cycle: This metric gives you the average time (usually days) it takes a salesperson to complete a deal. Compare this data to the age of the sales opportunity to see if it matches your complete sales funnel goals.
- Closed won opportunities: Looking at your closed opportunities can quickly show you how much revenue your sales team has generated within a set time. This metric can be helpful if your company has commission goals or bonuses.
- New business vs. upsell: With this metric, you can keep track of sales to existing customers compared to new customers.
- Win/loss rate: This metric is good for each individual salesperson. They can quickly see their win/loss rate and how it compares with the average. If their rate drops, they can look for reasons why, such as leads hitting roadblocks in the sales funnel or the need to adjust their sales pitch.
According to research from the RAIN Group, the average win/loss rate is 47% across multiple industries.
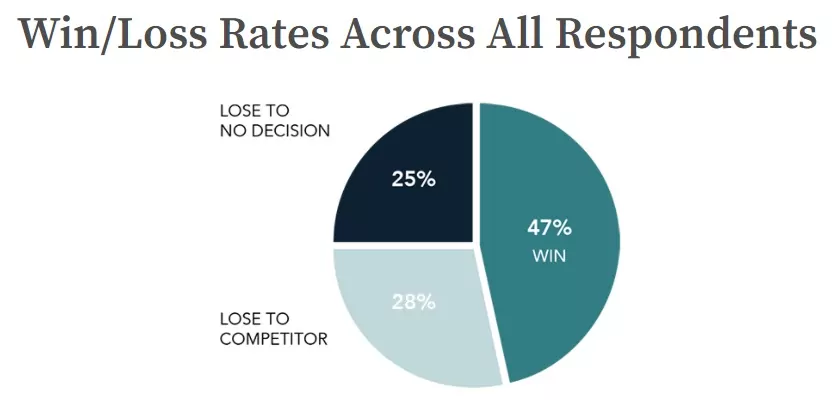
Source: Rain Sales Training
- Product gaps: When your company has a new product or service available, you typically predict how well you expect it to sell. The product gap KPI will show you the difference between that prediction and the actual sales.
- Open opportunities: One of the most important metrics to your sales success is how many open opportunities you have. If you have more open opportunities than you can handle, you might need to expand your sales team. On the other hand, if you don’t have enough, you need to grow your pipeline.
- Open activities: For a salesperson, open activities are like a to-do list. It includes things like calls, customer visits, and demos. If there are too many open activities, you may need to reevaluate the workload.
- Open cases: When customers initiate contact, they become open cases. These are time-sensitive, high-priority cases that should be closed as quickly as possible.
- Opportunities past due: This metric keeps track of missed opportunities, which frequently happens in most sales departments. However, your salespeople may have too many leads and clients to handle if this number gets too high.
- Sales close date: With this KPI, you can gauge the average time it takes leads to convert into customers. Use this data to forecast future sales.
Automate Your Data with MXTR
It is time to get rid of the manual spreadsheets and switch to a modern sales dashboard tool. MXTR offers automated technology that can gather your sales data, including customer data and lead generation.
If you are tired of losing leads and want to see your sales team succeed, schedule a demo with MXTR today.
Featured Image: istockphoto