
Everything sales agents and customers do create data. However, unless businesses know how to read and use the data, all that valuable information sits in the cloud. Sales reporting takes those numbers and translates them into actionable insights businesses use to motivate, measure, and improve.
Learn how to use sales reporting to boost your business’s performance.
Key Takeaways:
- Sales reporting summarizing the sales performance of a business during a set period
- Use sales reports to identify weaknesses, build on strengths, analyze results, and motivate sales agents
- Collect data for your reports from a data management program that works with multiple revenue channels

What Are Sales Reports?
Sales reports analyze and record sales activity. A sales report summarizes the business’s actions during a set time and how successful those strategies were. Reporting plays a crucial role in sales enablement as it provides the information sales agents need to improve their performance. Businesses that invest in sales enablement see a 15% improvement in their lower-performing agents and a 6%-20% increase in sales.
Sales analysis helps those involved in sales understand what’s working and whether the sales strategies consistently reach company goals. The sales report also allows the sales and marketing team to share their impact with others, like individual agents or higher managers.
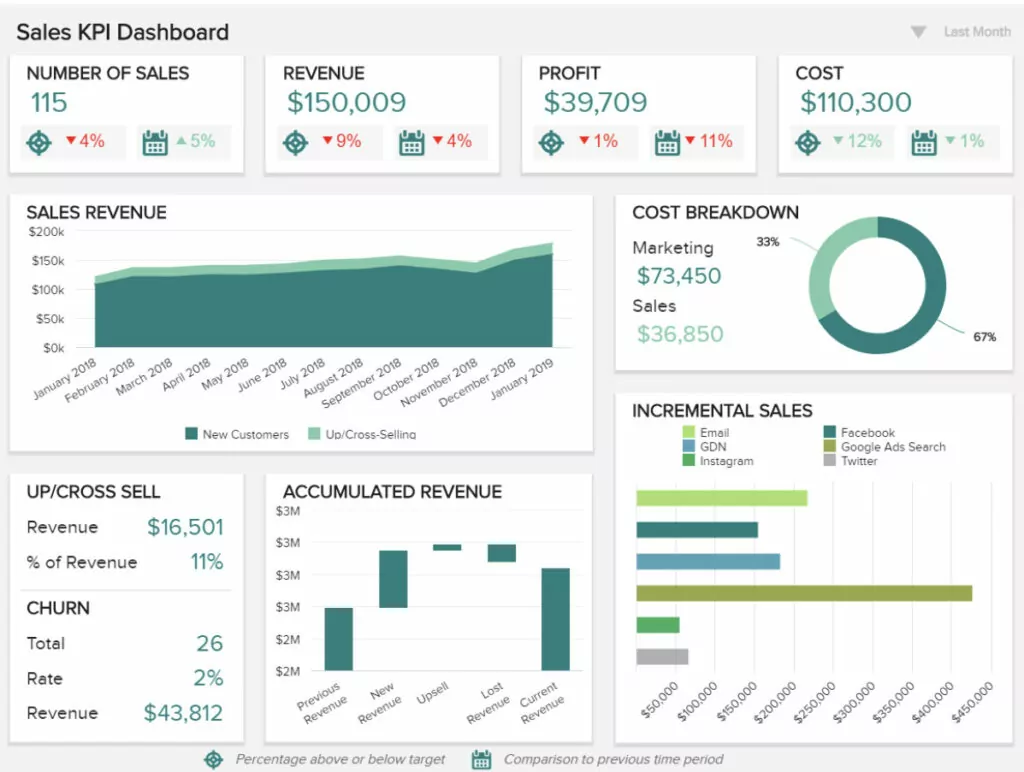
Source: DataPine
What Goes in a Sales Report?
Most sales reports contain the following elements:
- Report Overview: A summary of the sales department so those outside the department or business can understand the data in context.
- Sales Data: Sales results from a set timeframe.
- Business Results: Insights into how sales impacted the overall business operations.
What Types of Sales Reports Are There?
Sales teams within franchises compile six primary sales reports to see how the business performed and what role each component played in helping it reach or miss the sales goals. On average, 60% of businesses hit their revenue goals.
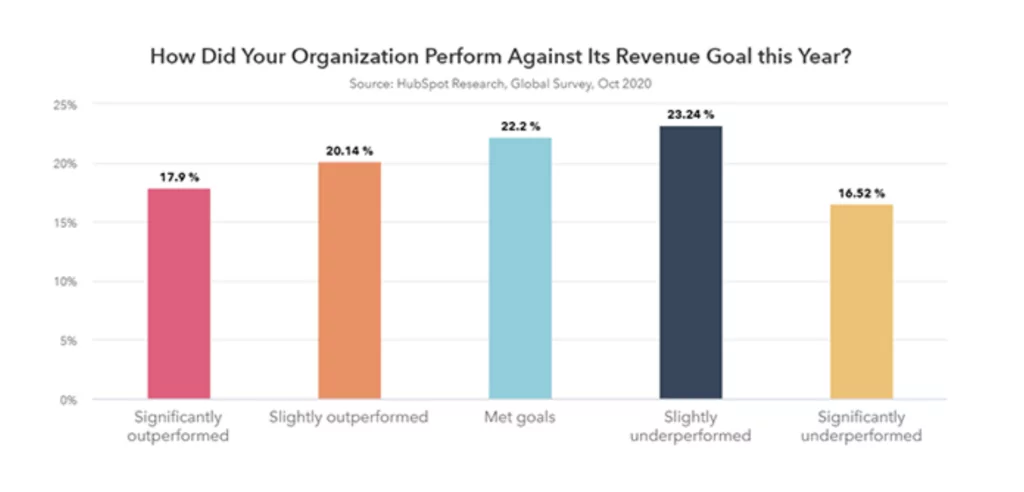
Source: Startup Bonsai
Individual Sales Agent Reports
Generate reports for each sales agent to show reps how well they performed compared to their peers. These reports are great motivators and help management know when agents need more sales enablement training or tools.
Location Sales Performance
Companies create sales reports for each location within a franchise. These reports can improve market participation from individual franchise locations and show the business managers when company locations need additional support.
Average Deal Size
This basic overview report shows how much a business earns on average from each sale. In addition, this report gives a general idea of how consistent sales are and helps companies to establish quotas and benchmarks.
Conversion Rate
A conversion rate report looks at total sales won and total sales lost. Then the report compares the two numbers to show the average conversion rate. The average conversion rate of sales-qualified leads is 20%, while top-performing companies convert 30% of sales-qualified leads.
Sales Breakdown Reports
Some sales reports look more in-depth at the sales process to identify potential problems and find the most significant strengths.
For example, a report might look at the loss rate by sales phase to find how far most leads move before they lose interest. This report can also look at the average sales cycle length to understand how long it takes to convert leads and how that impacts the sales rate.
Marketing Collateral Used
The marketing collateral report is essential for understanding the ROI of marketing and sales strategies. This report summarizes what resources and assets marketers and sales agents used and the results of that investment. The report helps sales agents know what sales and marketing efforts yielded the best results and where to reallocate the budget and resources.
How to Perform Sales Reporting
These five steps will help you create insightful and actionable sales reports that improve your sales outcomes:
Step 1: Choose Your Report’s Purpose
Keep the sales report focused on a single goal to avoid extra and confusing data irrelevant to the outcome. For example, if the report is for individual sales performance, you would only include data connected to a single sales agent in the monthly sales report.
Step 2: Create a Report for the Intended Audience
A report for the managers within the company would have more information on the impact of sales on the overall company. However, a sales report for sales agents would have deeper analytics of the sales process rather than just a total sales number to help agents understand their performance.
Those are just a few differences in reports depending on the audience. That’s why sales agents need to build reports with a specific audience in mind to ensure the audience sees the data they need.
Step 3: Set a Timeframe
Sales reporting happens regularly to give teams comparable data to look back on. For instance, if the last sales report covered a quarter, the following report should also cover a quarter.
Sales teams typically create these reports monthly, quarterly, or annually. However, some places may also provide daily or weekly reports, depending on their purpose and the number of conversions. For instance, a call center might have daily sales reports since the agents work with a higher daily volume of leads. However, B2B sales agents would look at monthly or quarterly reports as they convert leads less frequently since the leads are of higher value.
Step 4: Compile Comprehensive Data
The most challenging part of sales reporting is compiling all relevant data. For example, sales teams might convert some customers over social media, while franchise locations also have physical store sales. Gathering data from an omnichannel franchise requires a data management system that regularly tracks sales performance across channels and creates real-time reports.
For example, MXTR’s sales reporting system tracks leads across locations and multiple channels to record all touchpoints and conversions. This complete data helps sales agents see the bigger picture of how well their strategies impacted sales.
Remember to put the data into charts to help the recipient understand the large amount of data easier. For instance, a line graph clearly shows the ups and downs of conversion rates over the weeks during a quarter.
Step 5: Customize the Insights
The last part of the sales report is turning the information into actionable insights that relate directly to the intended recipient. For example, a sales report to business managers should include insights about how sales performance impacted company revenue. Then, sales reports going to agents look at why there were dips and why the sales team performed well at other times. These insights help agents improve future sales efforts.

Track Your Sales Performance More Efficiently
Create comprehensive regular reports through MXTR. Our lead management software tracks multiple locations and channels simultaneously, giving managers access to real-time and accurate data for all reporting needs.
Schedule a demo to see the power of our data collection and reporting software.
Feature Image: istockphoto